您现在的位置是:网站首页> 编程资料编程资料
python matplotlib画图时坐标轴重叠显示不全和图片保存时不完整的问题解决_python_
![]() 2023-05-26
555人已围观
2023-05-26
555人已围观
简介 python matplotlib画图时坐标轴重叠显示不全和图片保存时不完整的问题解决_python_
问题
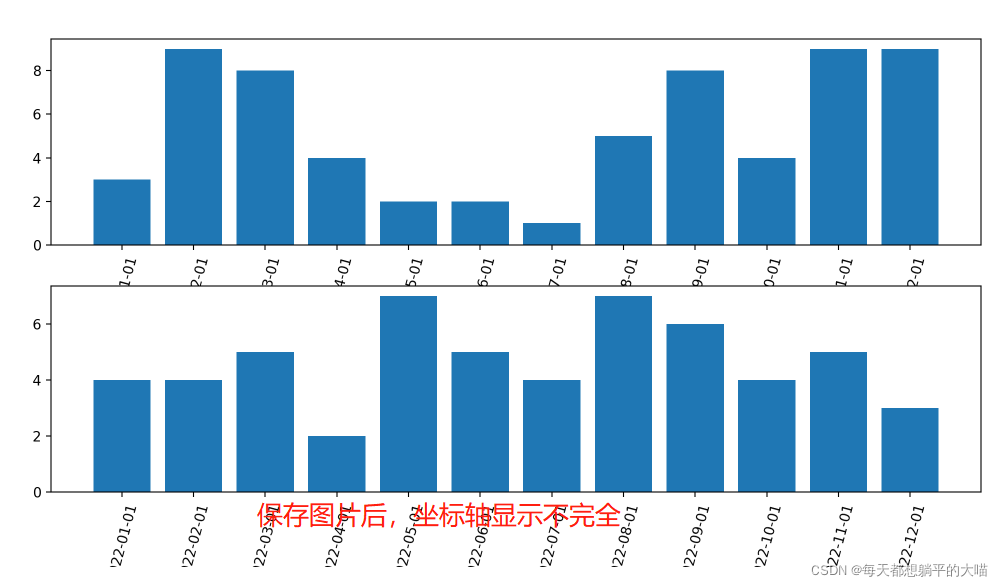
在使用matplotlib作图的时候,有的时候会遇到画图时坐标轴重叠,显示不全和图片保存时不完整的问题。如下:

解决方案
画图时重叠或者显示不全的问题
- 画图时加上参数设置
tight_layout=True - 画完所有子图后,设置
plt.tight_layout()
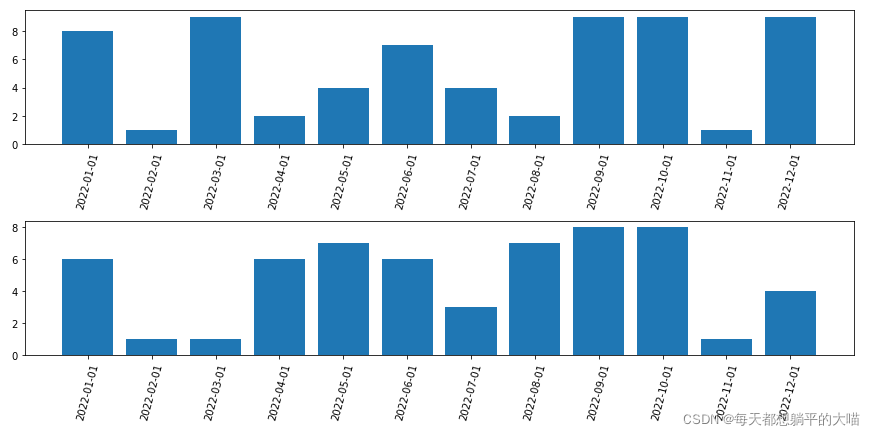
# 加上tight_layout=True 参数设置 fig, axes = plt.subplots(nrows=2, ncols=1, figsize=(12,6), tight_layout=True) labels = ['2022-{}-01'.format(str(i).zfill(2)) for i in range(1,13)] y1 = np.random.randint(low=1, high=10, size=12) y2 = np.random.randint(low=1, high=10, size=12) axes[0].bar(labels, y1) axes[0].set_xticks(labels) axes[0].set_xticklabels(labels, rotation=75) axes[1].bar(labels, y2) axes[1].set_xticks(labels) axes[1].set_xticklabels(labels, rotation=75) plt.savefig('test.png', dpi=200) fig, axes = plt.subplots(nrows=2, ncols=1, figsize=(12,6)) labels = ['2022-{}-01'.format(str(i).zfill(2)) for i in range(1,13)] y1 = np.random.randint(low=1, high=10, size=12) y2 = np.random.randint(low=1, high=10, size=12) axes[0].bar(labels, y1) axes[0].set_xticks(labels) axes[0].set_xticklabels(labels, rotation=75) axes[1].bar(labels, y2) axes[1].set_xticks(labels) axes[1].set_xticklabels(labels, rotation=75) plt.tight_layout() # 这里加上plt.tight_layout(),记住要在画完所有子图后 plt.savefig('test.png', dpi=200) 效果如下:
保存时图片不完整的问题
在plt.savefig中加入bbox_inches='tight’参数设置
fig, axes = plt.subplots(nrows=2, ncols=1, figsize=(12,6), tight_layout=True) labels = ['2022-{}-01'.format(str(i).zfill(2)) for i in range(1,13)] y1 = np.random.randint(low=1, high=10, size=12) y2 = np.random.randint(low=1, high=10, size=12) axes[0].bar(labels, y1) axes[0].set_xticks(labels) axes[0].set_xticklabels(labels, rotation=75) axes[1].bar(labels, y2) axes[1].set_xticks(labels) axes[1].set_xticklabels(labels, rotation=75) plt.savefig('test.png', dpi=600, bbox_inches='tight') # savefig时加入bbox_inches='tight'参数设置 补充:使用matplotlib时如何让坐标轴完整显示所有的标签刻度
在使用matplotlib时,由于数据量过大,在默认设置下,使用plot等时,会将x,y轴的刻度按一定比例缩减掉一部分,如:1,2,3,4,5,6,7,8,9,10会显示成2,4,6,8,10等,解决方法是使用xticks()和yticks():
xticks(ticks=None, labels=None, **kwargs)
ticks:x轴显示的数值(类型:list),若为空,则x轴上不会显示任何数值;
labels:标签项,当ticks不为空时,labels内容将覆盖ticks的内容
**kwargs:控制标签内容的排版
Return:
- locs:返回x轴坐标列表
- labels:返回x轴标签列表
总结
到此这篇关于python matplotlib画图时坐标轴重叠显示不全和图片保存时不完整问题解决的文章就介绍到这了,更多相关matplotlib画图时坐标轴重叠显示不全内容请搜索以前的文章或继续浏览下面的相关文章希望大家以后多多支持!
相关内容
- Python 任务自动化工具nox 的配置与 API详情_python_
- Python脚本提取fasta文件单序列信息实现_python_
- Python利用VideoCapture读取视频或摄像头并进行保存_python_
- Python中线程threading.Thread的使用详解_python_
- python合并RepeatMasker预测结果中染色体的overlap区域_python_
- Python一阶马尔科夫链生成随机DNA序列实现示例_python_
- 自学python求已知DNA模板的互补DNA序列_python_
- python数据分析绘图可视化_python_
- Django上传excel表格并将数据写入数据库的详细步骤_python_
- Python Pandas数据处理高频操作详解_python_